[Sentry] Performance
Metrics
參考資料
Metrics @ Sentry Docs
Apex
- 根據 App 的反應時間來測量使用者的滿意度
- 越高越好,最高可以到
1.0
User Misery
- 反映出對使用者最有負面影響的 transactions
- 800/1000 的 miserable users 會比 5/5 miserable users 的 misery score 來的更高
P50, P75, P95, P99 Threshold
-
表示有超過
(100 - n)%的 transaction 的時間超過這個值,數值越低越好 -
如果 p50 threshold 是 10ms,表示所有的 transaction 中有 50% 會超過 10ms 這個 threshold。
-
如果 p75 threshold 是 10ms,表示有 25% 的 transaction 會超過 10ms 這個 threshold 。
-
如果 p95 threshold 是 10ms,表示有 5% 的 transaction 會超過 10ms 這個 threshold 。
Distributed Tracing
參考資料
Distributed Tracing @ Sentry
Trace vs. Profile
- Tracing 和 Profiling 不同,雖然他們都能用來診斷 App 的問題,而且目的有些重疊。
- Sentry 用的是 Trace
- Profile
- 測量 App 運作時的各個數據,例如,執行了多少操作、記憶體用了多少、function call 花了多少的時間
- 最後結果會得到的是一份測量數據的摘要
- Trace
- 關注在 what 和 when 而非花了多久時間
- 最後結果會得到一系列程式執行時的 event log
- 也因為有這個 event log,所以可以用來推算 performance
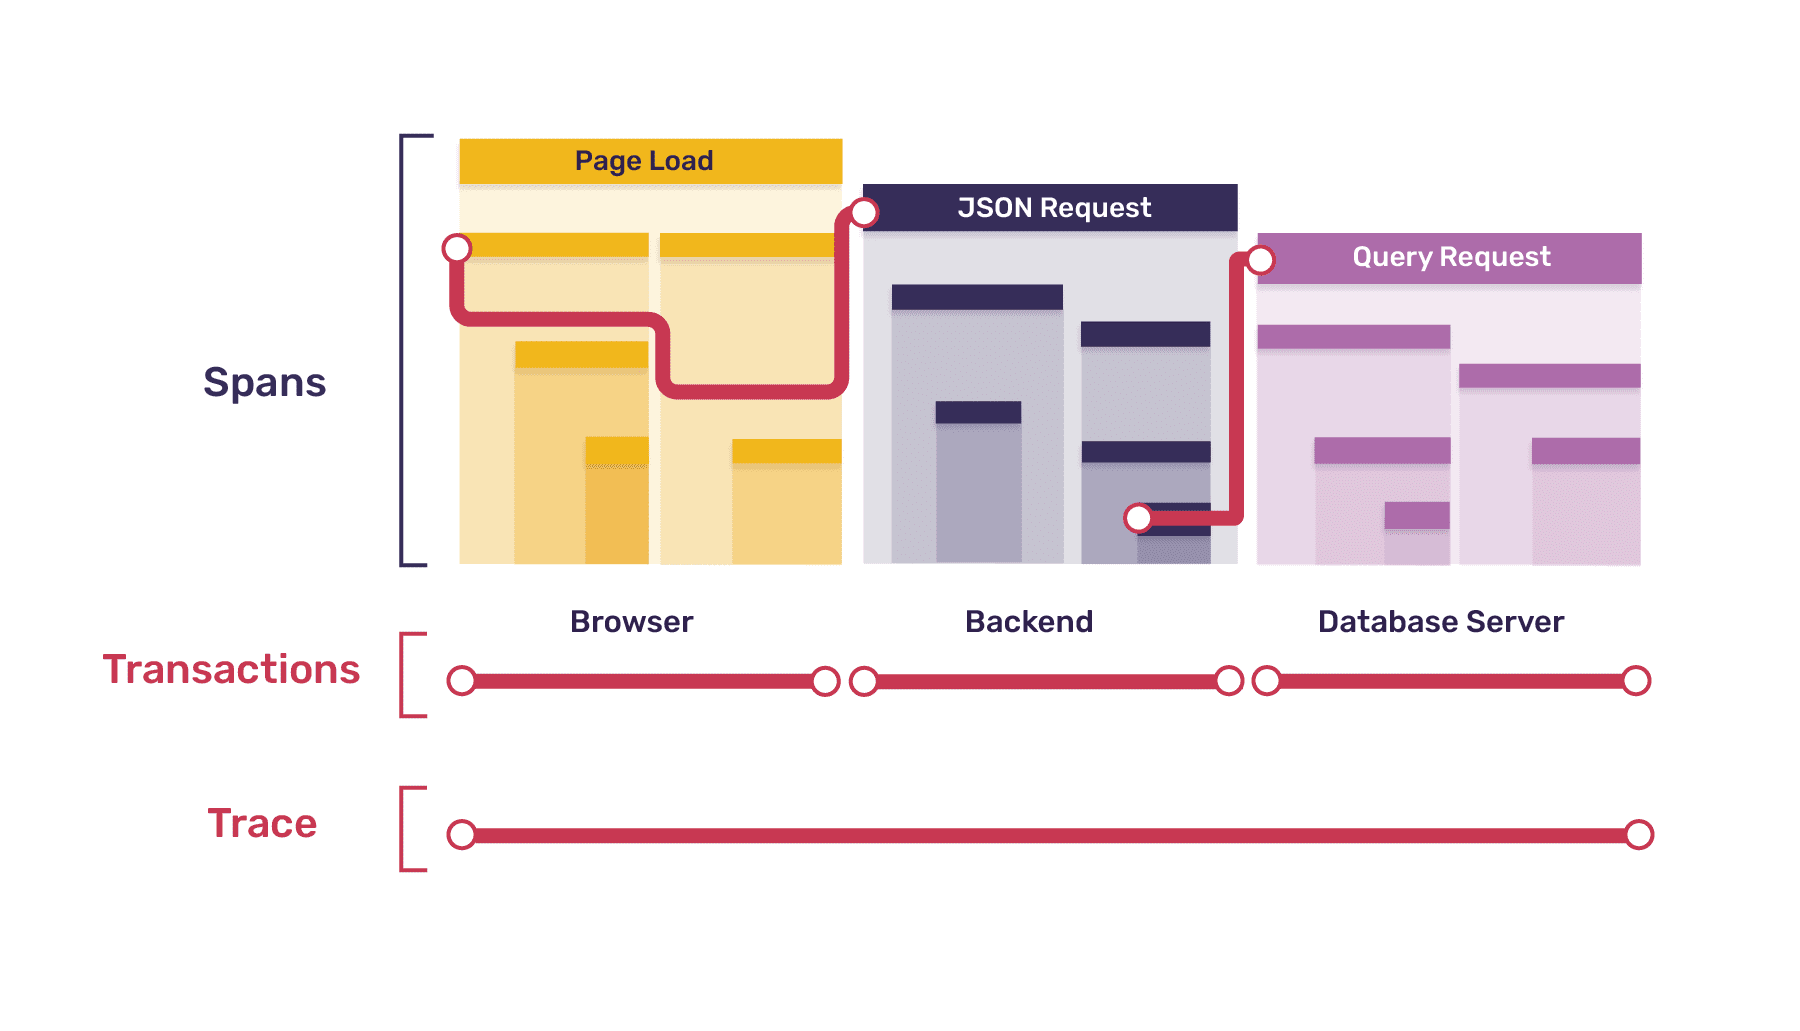
- 透過 tracing,可以衡量不同 server 間交互後的表現,例如從 FE 送 request,BE 在背後處理資料、最後 FE 再次收到資料的整個過程
Trace, Transactions, and Spans
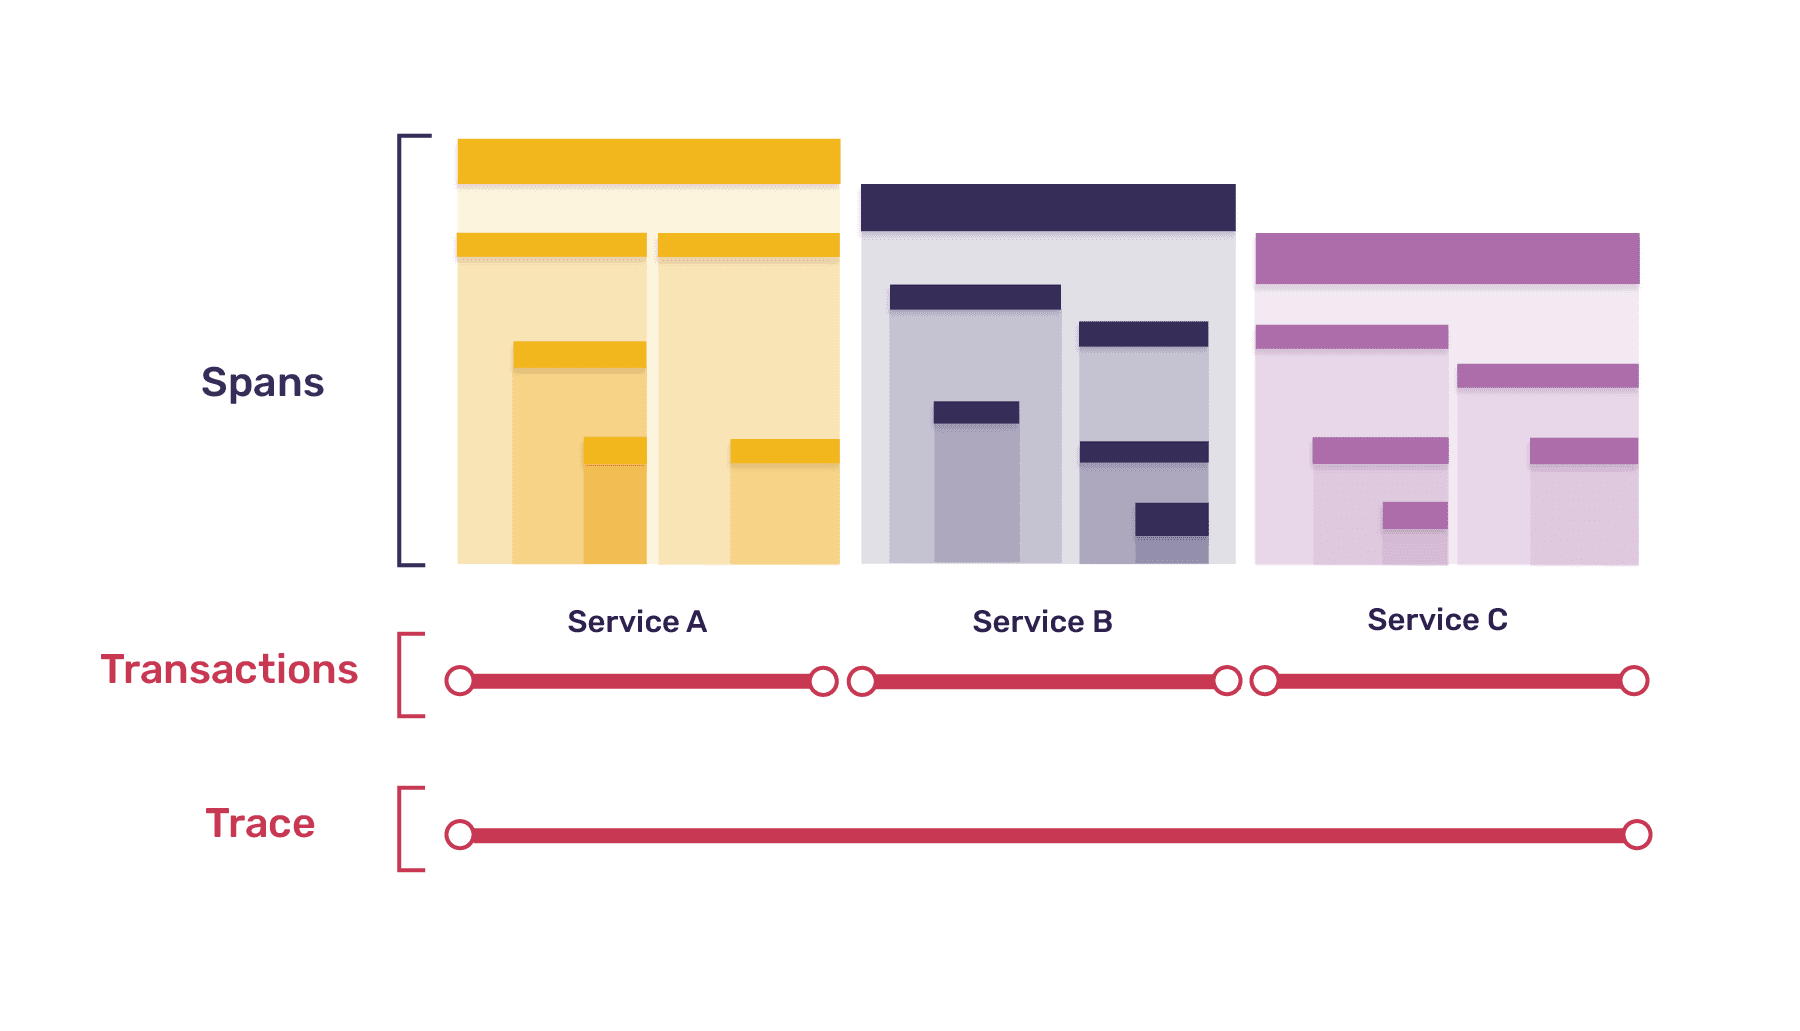
-
distributed trace:當一個 trace 包含了多個不同的服務時
-
Transaction:
- 每一個 trace 中都含有一個以上的樹狀結構,稱作
transactions - 同一個 trace 底下的 transactions 會有相同的
trace_id - Transaction 和 root span 幾乎有相同的 properties,除了 transaction 會多一個
transaction_name之外
- 每一個 trace 中都含有一個以上的樹狀結構,稱作
-
Span:每個 transactions 中的 node 則稱作
spans- 由於是樹狀結構,所以一定有一個 root span;一個 parent span 也可能底下有多個 child span
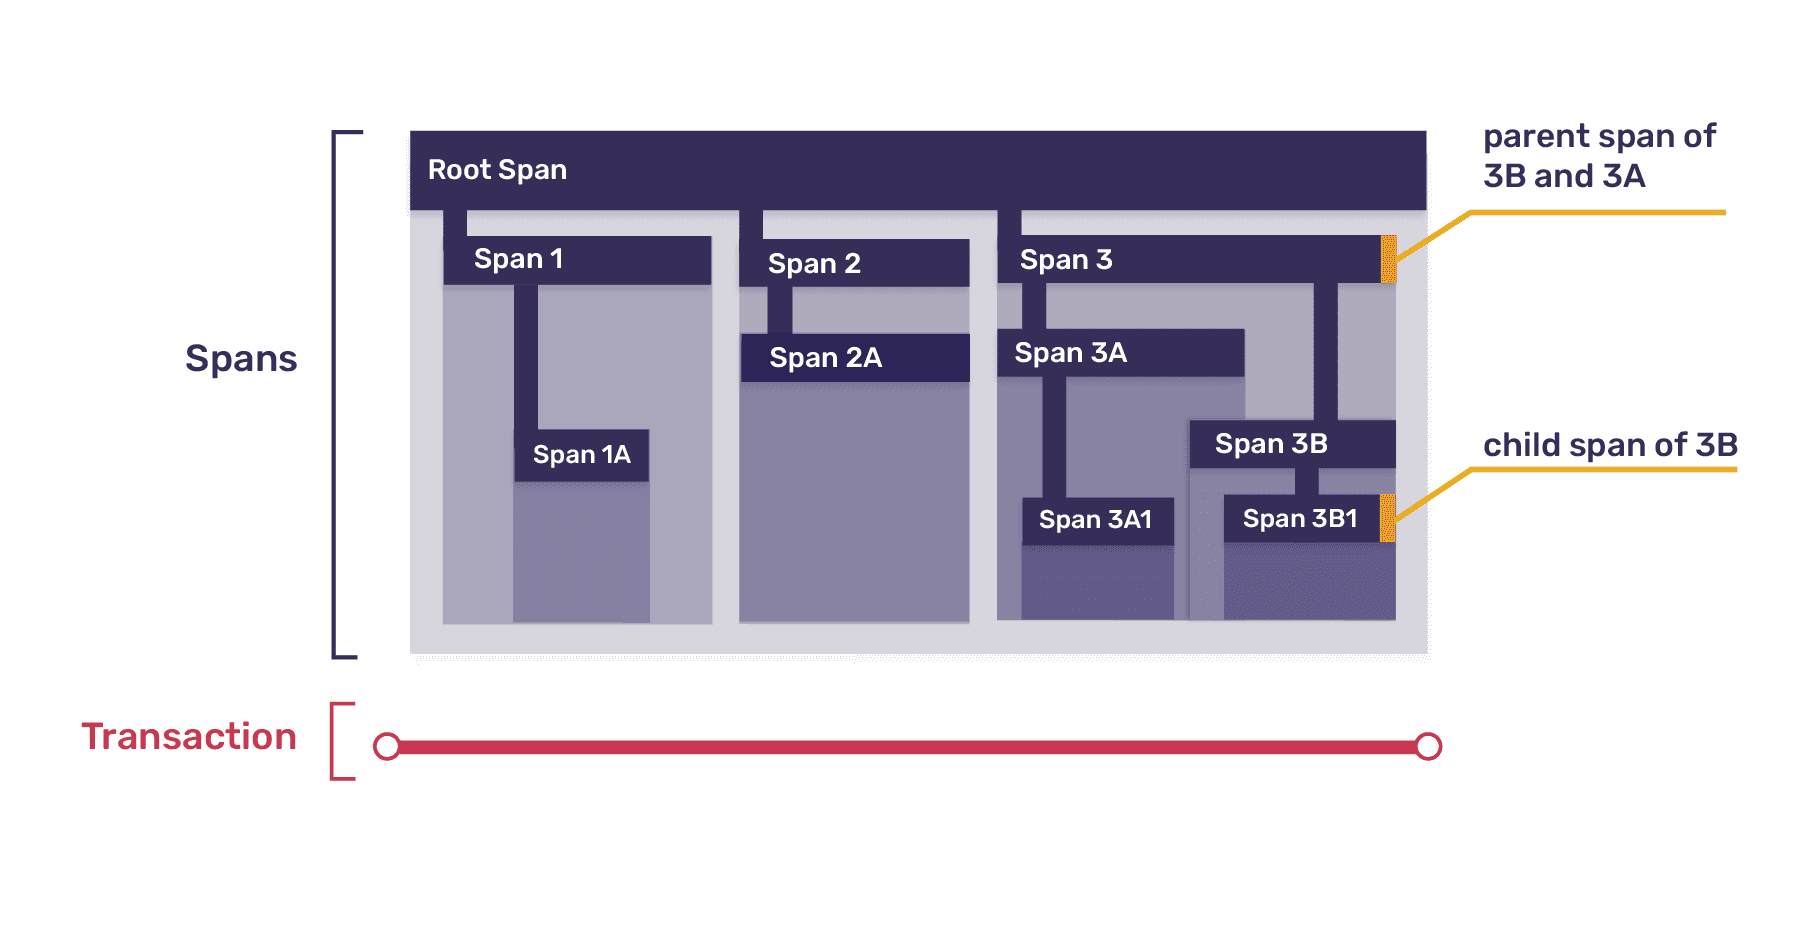
-
一個 transaction 的 child span 同時也可能是另一個 transaction 的 root span
-
-
資料包含了
parent_span_idstart_timestampend_timestampop:該 span 的 operation 類型descriptionstatustagsdata
Event Detail
參考資料
Web Vitals
參考資料
Web Vitals @ Sentry Docs