[Chrome] Chrome Dev Tool (Get Started with Debugging JavaScript in Chrome DevTools)
TL;DR
基本 console 使用
/**
 * 視覺化呈現
**/
console.warn('<output>')
console.error('<output>')
console.clear()

console.dir(<DOMElement>)        // 以物件的方式列出該 DOM 元素與相關屬性
console.dirxml(<DOMElement>)      // 以 HTML 樣式輸出 DOM 元素
console.table([object/array])      // 將物件以表格方式呈現

/**
 * 偵錯
**/
console.trace('Trace this function');
debugger;
debug(<functionName>);          // 在 console 中輸入,當執行到此函式時會中斷

/**
 * 效能測試
**/
console.time('<timerName>');           // 開始為 'timerName' 計時
console.timeEnd('<timerName>');        // 結束 'timerName' 計時
console.count('counterName');        // 為 'counterName' 計數

/**
 * 選取器
**/
$0;
$('.class-name')       // 找到第一個 .class-name
$$('.class-name')      // 找出所有 .class-name

/**
 * 將輸出資料分群顯示
**/
console.group('<groupName>')             // 開始分群,預設展開
console.groupCollapsed('<groupName>')    // 開始分群,預設不展開
console.groupEnd()                       // 結束分群

/**
 * 使用 '%c' 幫輸出的內容添加樣式
**/
console.log('%c What a Cool Console', 'font-size: 32px; color: red')
監聽事件
monitorEvents(element [,event])     //    監聽某一元素
unmonitorEvents(element [,event])   //    取消監聽某一元素
getEventListeners(element)          //    查看某一元素綁定了哪些事件
選擇 DOM 元素
$0; // 表示當前所選元素
$(selector); // 等同於 document.querySelector()
$$(selector); // 等同於 document.querySelectorAll()
好用指令
使用 cmd + shift + p 進入 chrome 命令程式輸入:
| 指令 | 說明 |
|---|---|
| capture full size screenshot | 螢幕截圖 |
| Show performance monitor | 顯示效能監視器 |
| Show frames per second (FPS) meter | 顯示轉譯速率 |
| Show Rendering | 顯示轉譯控制器 |
Console 的使用
常用的 console 指令
keywords: console.warn(), console.error(), console.assert()
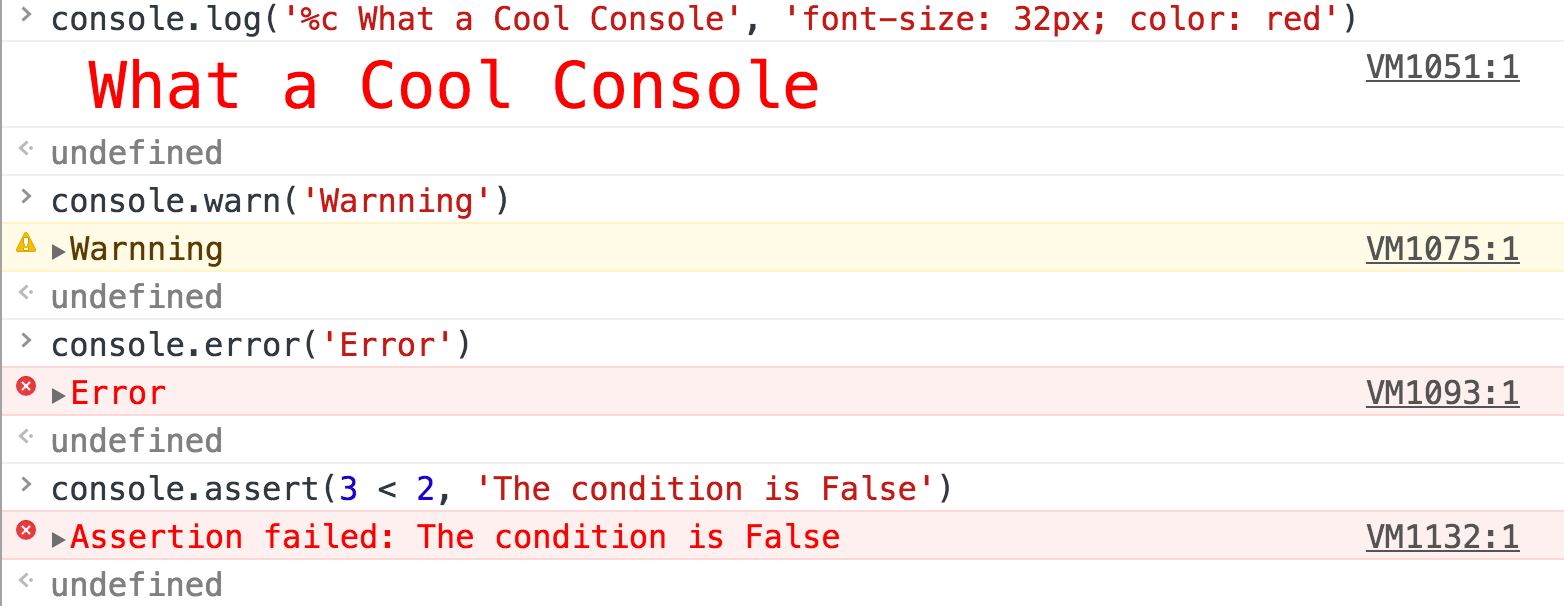
有一些可以幫助我們 debug 方便檢是的 console 指令像是console.warn(), console.error(), console.assert(condition, '<output'>):
檢視 HTML 元素
keywords: console.dir(<HTMLElement>), console.dirxml(<HTMLElement>)
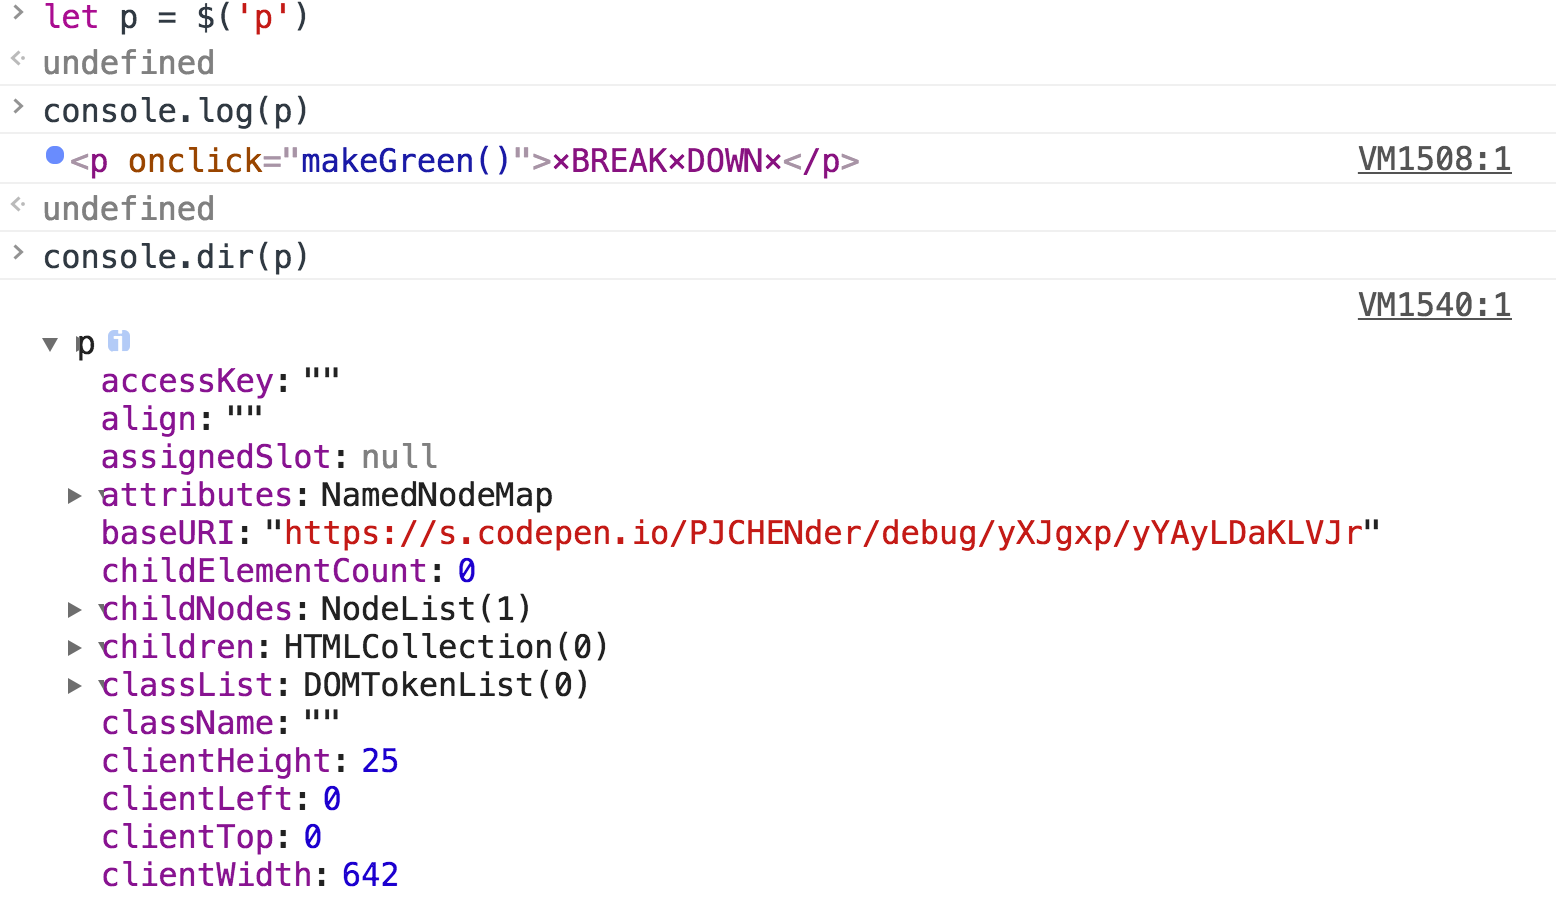
使用 console.dir(<HTMLElement>) 可以幫助我們檢視這個 DOM 元素中的所有屬性:
使用 console.dirxml(<HTMLElement>) 則可以幫助我們用 HTML 的格式檢視這個 element:

將輸出的資料群組起來
keywords: console.group(<groupName>), console.groupCollapsed(<groupName>), console.groupEnd()
假設我們有一組色票檔:
let colorData = [
  {
    name: 'facebook',
    colorCode: '#4267b2',
  },
  {
    name: 'green',
    colorCode: '#41CEC0',
  },
  {
    name: 'vue',
    colorCode: '#41b883',
  },
];
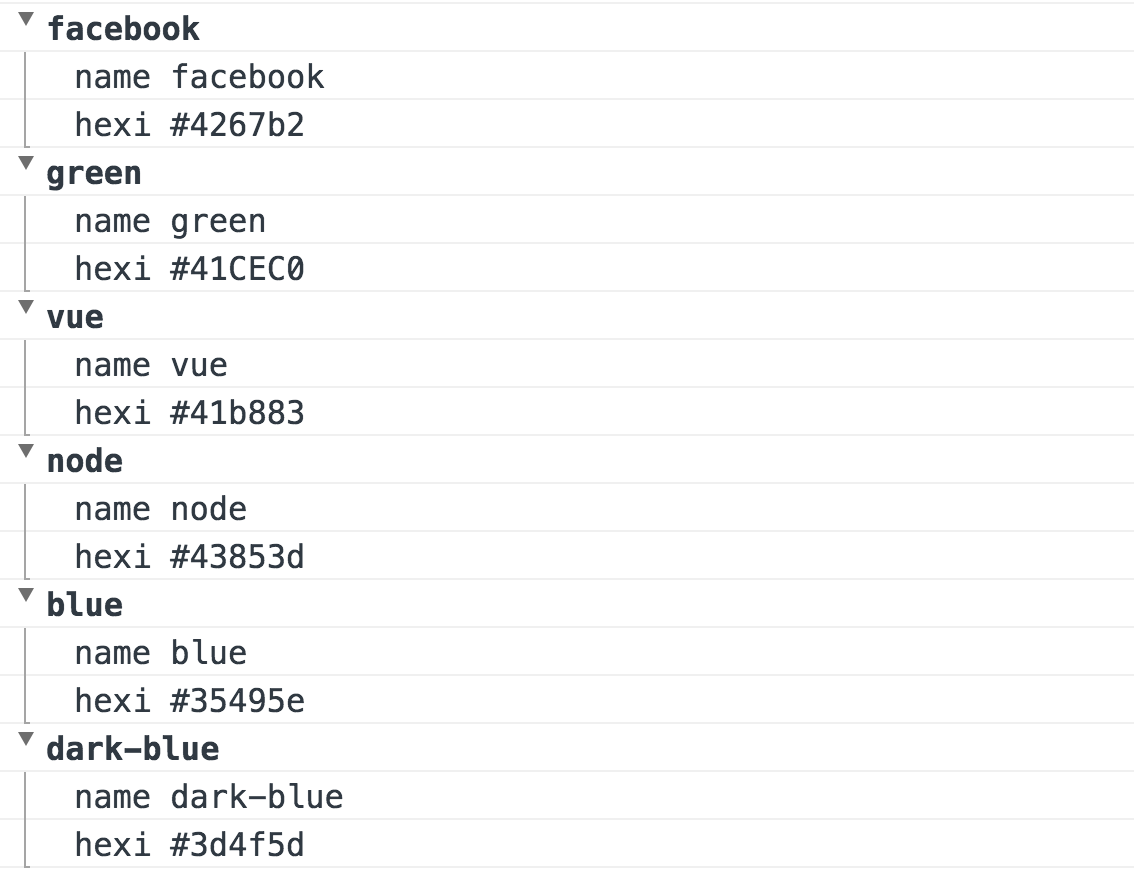
我們可以使用 console.group() 搭配 console.groupEnd() 來將輸出的資料分群,像是這樣:
colorData.forEach((color) => {
  console.group(color.name);
  console.log('name', color.name);
  console.log('colorCode', color.colorCode);
  console.groupEnd();
});
輸出的結果會像這樣:
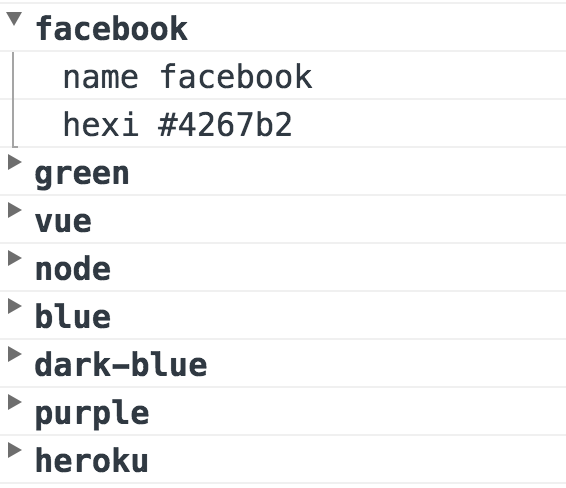
如果我們希望預設群組的結果是關閉的,則可以使用 console.groupCollapsed(),需要的時候在打開來看:
colorData.forEach((color) => {
  console.groupCollapsed(color.name);
  console.log('name', color.name);
  console.log('colorCode', color.colorCode);
  console.groupEnd();
});
輸出的結果會像這樣:
檢視 AJAX Request
keywords: Log XMLHttpRequests
在 console 視窗中點右鍵,勾選 "Log XMLHTTPRequest" 就可以看到該網站所發出的 AJAX request:

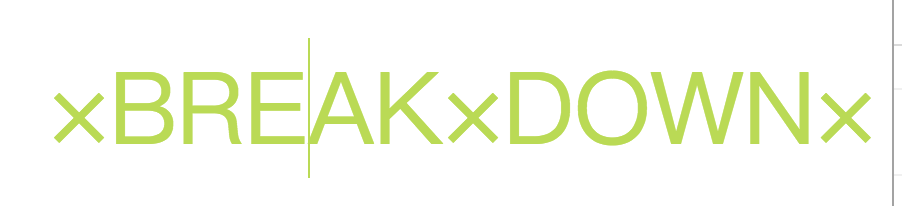
讓瀏覽器可以直接編輯網頁
在 console �中輸入
document.designMode = 'on';
點選網頁文字會直接出現游標,可以直接編輯:
改變 console.log 的樣式
我們可以在 console.log() 的函式中使用 %c,後面再放入 CSS 樣式,就可以改變 console.log 輸出的文字樣式:
console.log('%c What a Cool Console', 'font-size: 32px; color: red');

Debugger 的使用
Debug 流程
- 發現(重現)問題
- 使用 Sources -> Event Listener Breakpoints 選擇要中斷的事件
- 審視原始碼,找出可能有問題的函式
- 在該函式可能有問題的程式碼行數的地方點一下,設定斷點(breakpoint),當程式碼執行到該處時,會出現相關訊息。
- 利用 watch 輸出某變項或 expression (類似 console.log),利用 console 視窗確認問題
- 找出問題後,直接在 source 的區塊內修改程式碼,修改好後按 cmd + S 儲存。
- 取消斷點,再次執行,看是否修正錯誤。
設定斷點(BreakPoints)
設定斷點最簡單的方式是直接在 JavaScript 的程式碼中加上 debugger 關鍵字,當 JS 執行到那行的時候就會停下來。
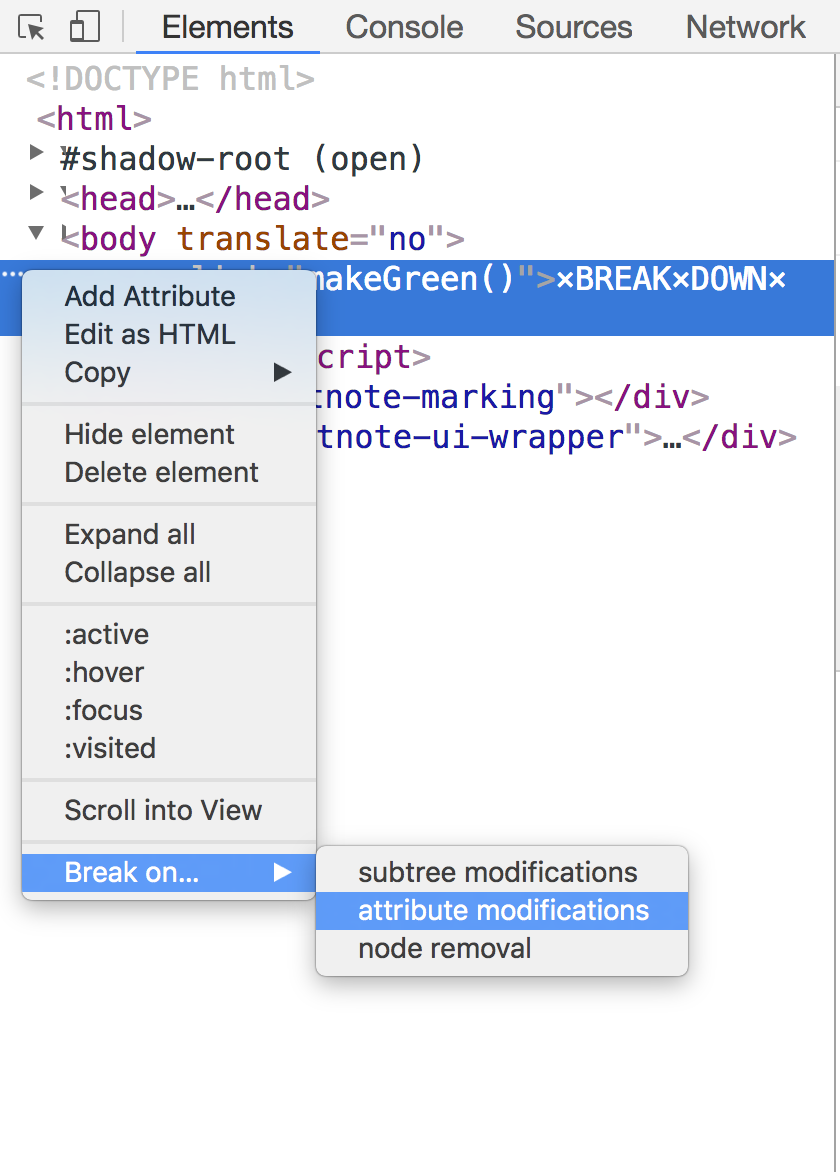
如果想要看該元素到底是觸發了什麼 JavaScript 事件,可以在該元素上面設定斷點。這裡因為點選該文字後會導致該元素的 CSS 屬性改變,因此我們選擇監聽 attribute modifications:
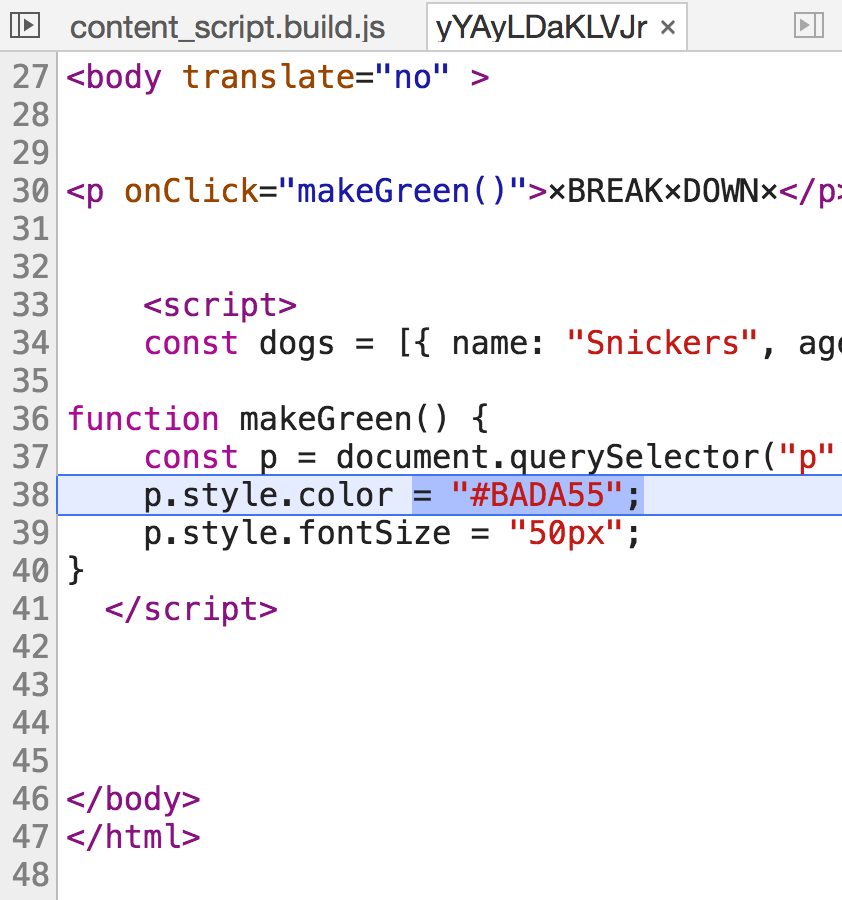
如此當你點選該文字觸發 JS 事件時,Debugger 就會停在這裡:
使用 Debugger
Step over Line of Code  (step over)
類似逐步執行的概念。在 A 停下來,按「Step Over Next Function Call」,則會執行 B、C,最後停在 D:
function updateHeader() {
  var day = new Date().getDay();
  var name = getName(); // A
  updateName(name); // D
}
function getName() {
  var name = app.first + ' ' + app.last; // B
  return name; // C
}
Step into Next Function Call  (step into)
進入該函式,在 A 停下來,按「Step Into Next Function Call」之後,會停在 B。
function updateHeader() {
  var day = new Date().getDay();
  var name = getName(); // A
  updateName(name);
}
function getName() {
  var name = app.first + ' ' + app.last; // B
  return name;
}
Step out of Current Function  (step out)
跳出該函式。停在 A ,按下 step out,會執行 getName ( ) 中剩下的 code(B),然後停在 C:
function updateHeader() {
  var day = new Date().getDay();
  var name = getName();
  updateName(name); // C
}
function getName() {
  var name = app.first + ' ' + app.last; // A
  return name; // B
}
監控事件處理(monitor event)
除了前面提到的可以在 attribute modifications 設定斷點來偵測觸發的事件外,我們也可以使用 Chrome 內建監聽事件的功能:
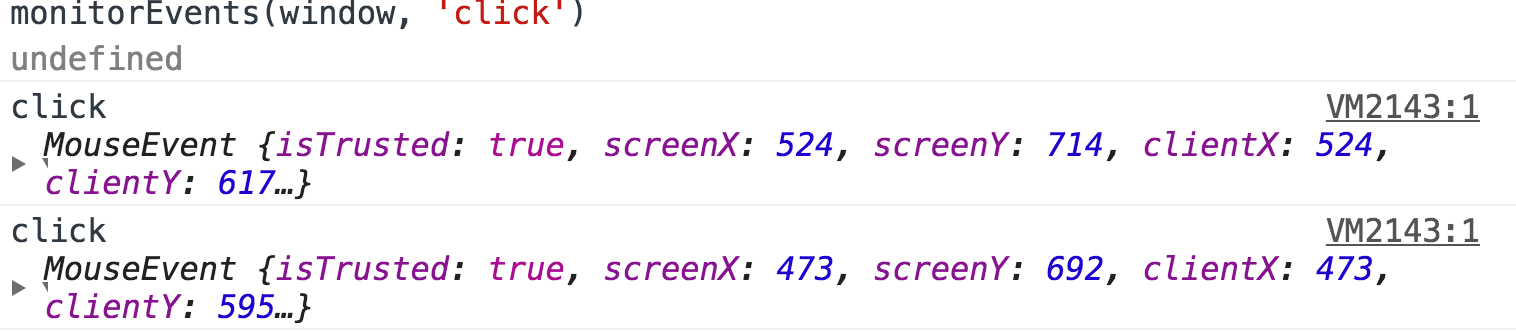
開啟事件監聽
我們可以在 console 中輸入 monitorEvents(element, [event]),後面的 event 是 optional 的,如果沒有填的話,它會監測該 element 被觸發的所有事件,一旦事件被觸發就會出現在 console 中:
關閉事件監聽
監聽完事件後,我們可以使用 unmonitorEvents(element, [event]) 來關閉事件監聽,後面的 event 一樣是 optional 的,沒有填的話,會關閉監聽該 element 的所有事件。
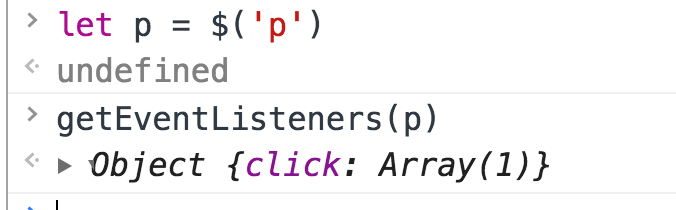
查看元素被綁定的事件
另外,我們也可以使用 getEventListeners(element),來看看某一個 DOM 元素被綁定了哪些��事件:
其他功能
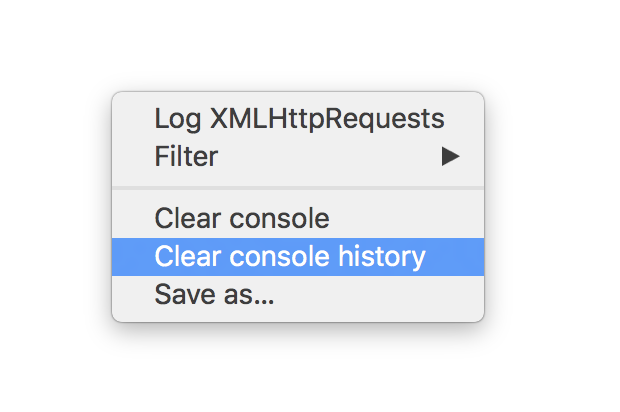
清除記錄
在 console 中,一般我們可以直接使用 console.clear() 來清除畫面,但是在 chrome 裡面會自動幫你記憶一些你打過的字,有時候自動填補的字並不是自己想要的,這時候我們可以在 console 視窗上點右鍵,選擇clear console history 就可以清除在 console 中曾經輸入過的歷史紀錄:
選擇 HTML 元素
在 chrome 中我們可以像使用 jQuery 一樣,使用 $ 當做選擇器,$ 表示的是 document.querySelector([selector]);如果要選擇多個 DOM 元素,要使用 $$,表示的是 document.querySelectorAll([selector])。
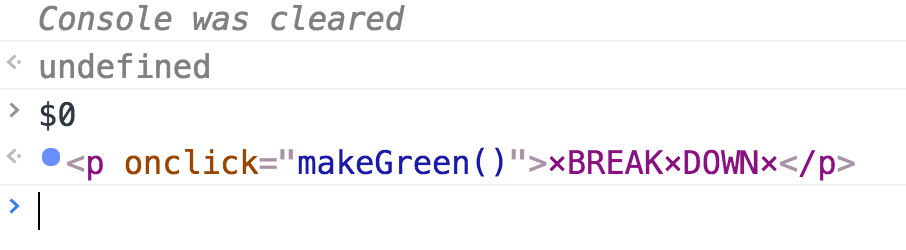
另外,你也可以在 element 視窗中點選一個 DOMElement��,接著在 console 中輸入 $0,一樣可以選到該元素,$0 表示的是當前 chrome 所選取到的元素:
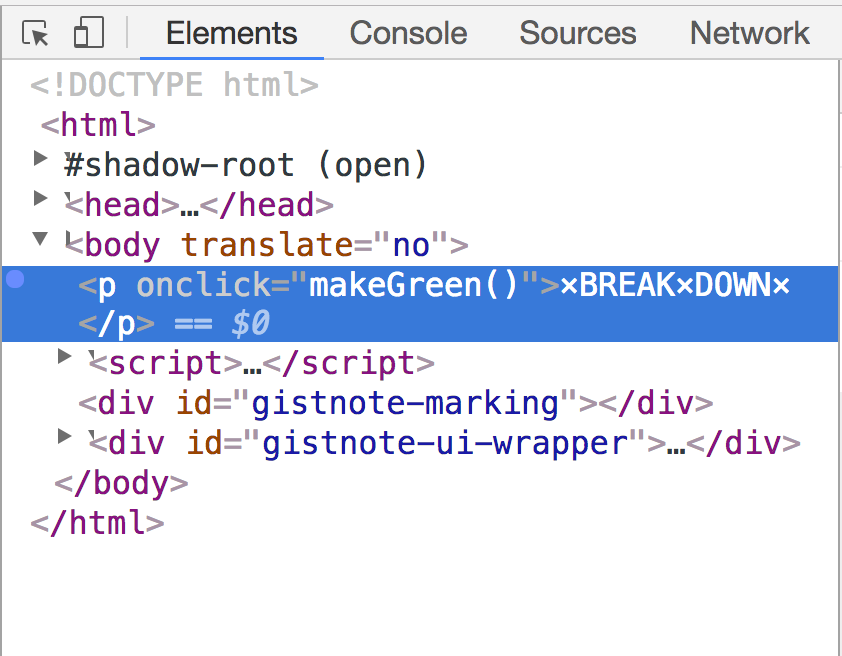
輸入 $0 可以選到當前在 element 選擇的 DOM 元素:
查看物件
在 console 中我們可以使用 keys(obj) 和 values(obj) 來取的物件的鍵和值:

其他尚未詳細整理的功能
/**
 * Handling Error and Exceptions
**/

console.trace()                                    //    印出目前的 JavaScript call stacks

window.onerror = function(message, url, line){     //    當有錯誤沒有被 try catch 補捉,就會促發 window.onerror
    console.log(`window.onerror is invoked with
    message = ${message}, url = ${url}, at line = ${line}`)
}

/**
 * Debug
 **/
debugger;
debug(function)                                   //    將某函式進入 debug 模式
undebug(function)                                 //    將某函式退出 debug 模式
monitor(fn)                                       //    監聽某一函式,會回傳函式名稱和使用的參數

/**
 * Output
 **/
dir(obj)                                          //    條列出物件,等同於 console.dir()
table(data [,columns])                            //    以資料表的方式調列出物件
inspect(obj/fn)                                   //    查看某元素或函式
參考資料
-
Using the Console @ Chrome Devtool
-
A Look at the JavaScript Console API @ Alligator
-
Day09: Must Know Dev Tool Tricks @ JS30